
This report can be viewed by the food bank admin, donor organisation admin and donor branch admin.
See Reports Glossary for a definition of all columns used in the report
For more information see Foodiverse KPI Reports - How does it work?
|
Contents |
Link |
|---|---|
|
Food Bank KPI Report |
|
|
|
|
|
Donor KPI Report |
|
|
|
Donor KPI Report (Donor KPI Summary/Donor KPI Report)
Donor branches KPI report can be used to view all the KPI for donor branches. The Donor KPI Report now includes a Summary Report and Detail Report tabs.
View report as Foodbank and Network Admin
Step 1: How to find the Donor KPI Summary Report
-
Log into your Foodiverse account using the foodbank and network admin credentials.
-
Select Reports from the left side menu.
-
Under Reports select Donor Branches KPI report
-
The first tab displays the Donor Summary Report, the second Tab display the Donor Detail Report.
Donor KPI Summary Report
Step 2: How to filter the Donor KPI Summary report to suit your search criteria
-
In User View: select Food Net Admin to view all the donor branches in your food network.
-
Select the Time Period - Month (Daily) will offer a Year/Month filter and display statistics for the Month chosen by Day. (Defaults to current month)
-
Select the Time Period - Year (Monthly) will offer a Year filter and display statistics for the Year chosen by Month.
-
Select the Time Period - All Time (Yearly) will display statistics on an annual basis including current year.
-
Use the Donor Organisation filter to limit the report to a particular donor or donors. (Mandatory)
-
Use the Donor Branch filter to limit the report to particular donor branches of the donor organisation that you have chosen.
-
The Labels filter can be used to search the reporting group.
-
Click the Submit button to run the report when you have chosen all your filters.
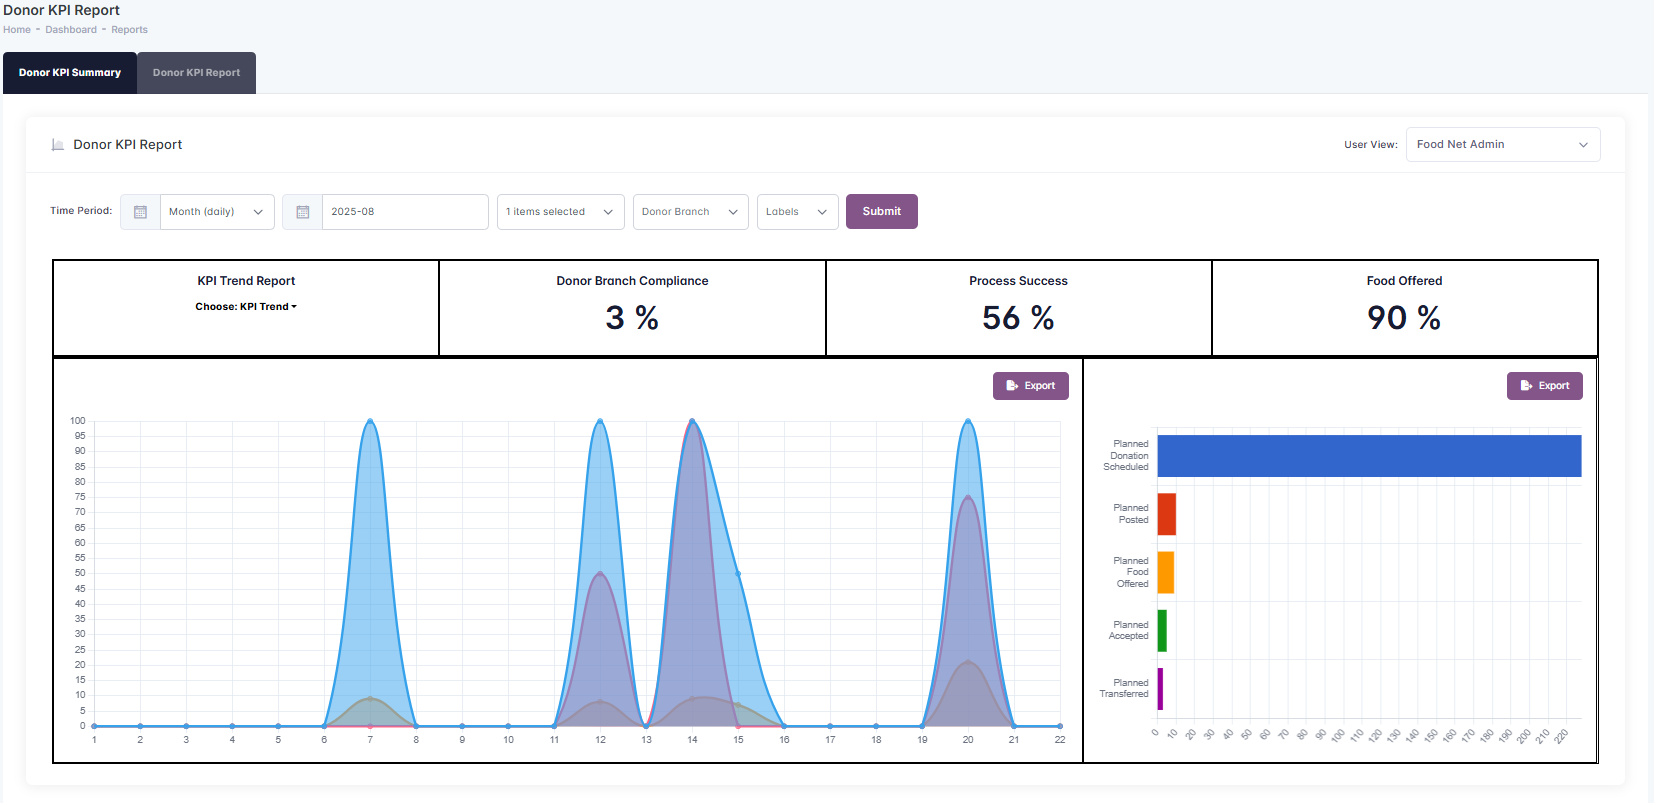
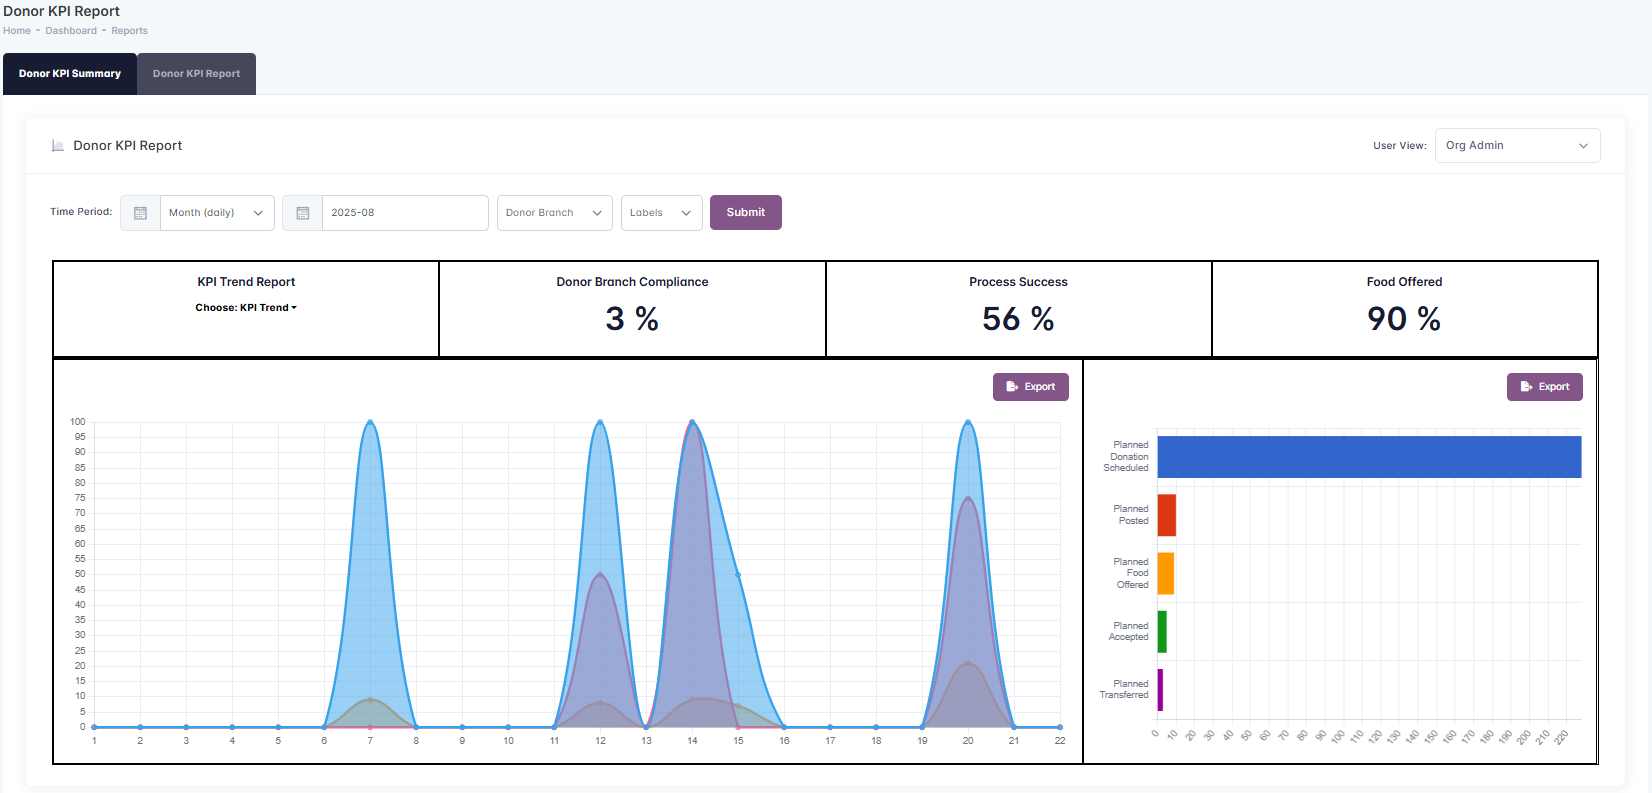
Step 3: Understanding the output of the Donor KPI Impact Summary report
-
The KPI Summary displays rates for Donor Branch Compliance, Process Success and Food Offered for the Time Period selected.
-
If you have setup RAG thresholds in your Organisation Settings, those featured Rates are colour co-ordinated on the Report.
-
-
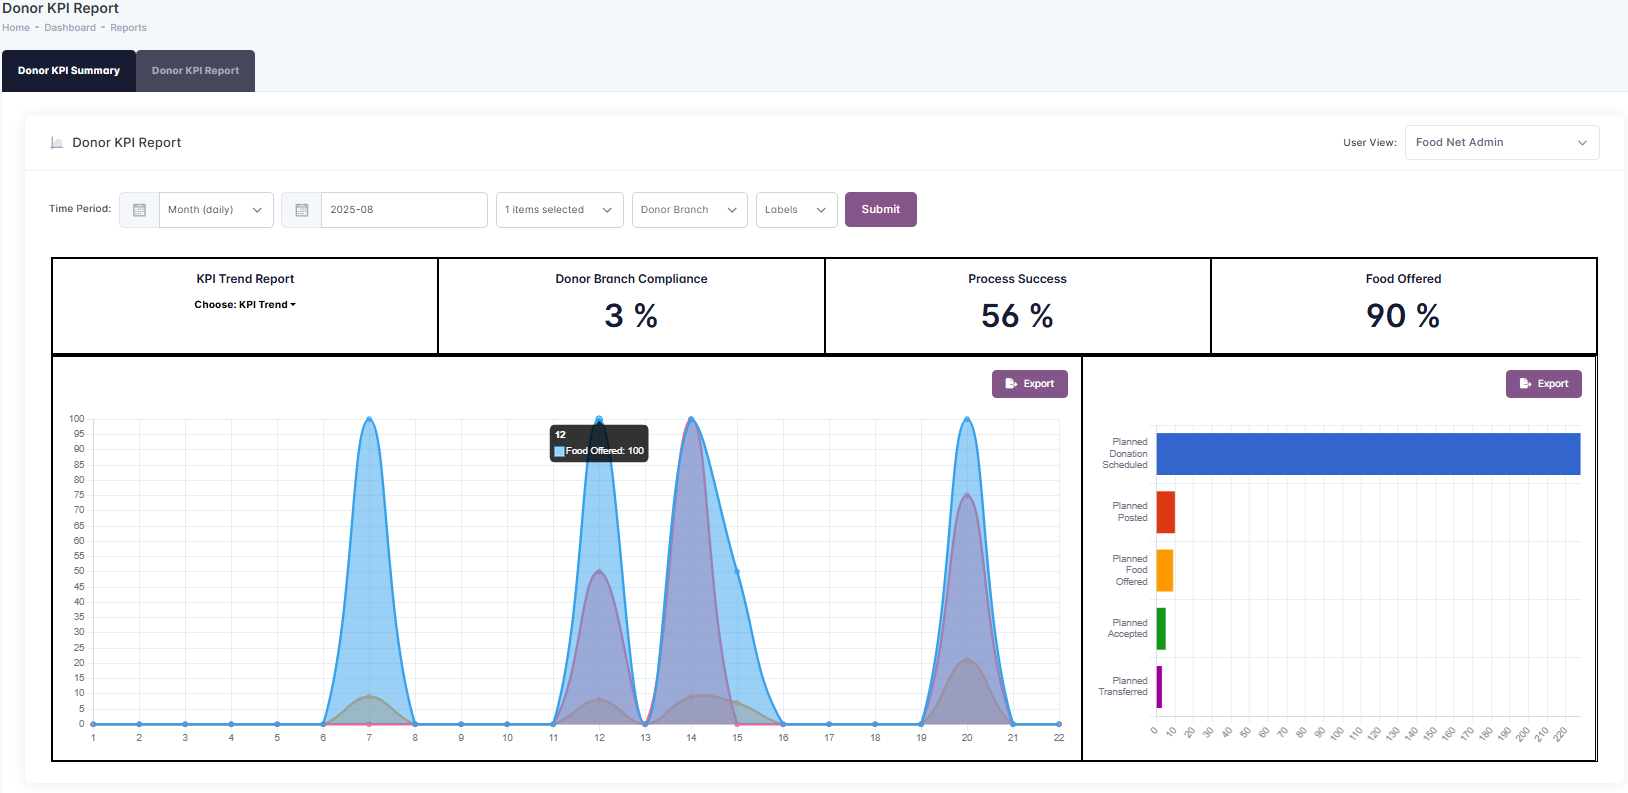
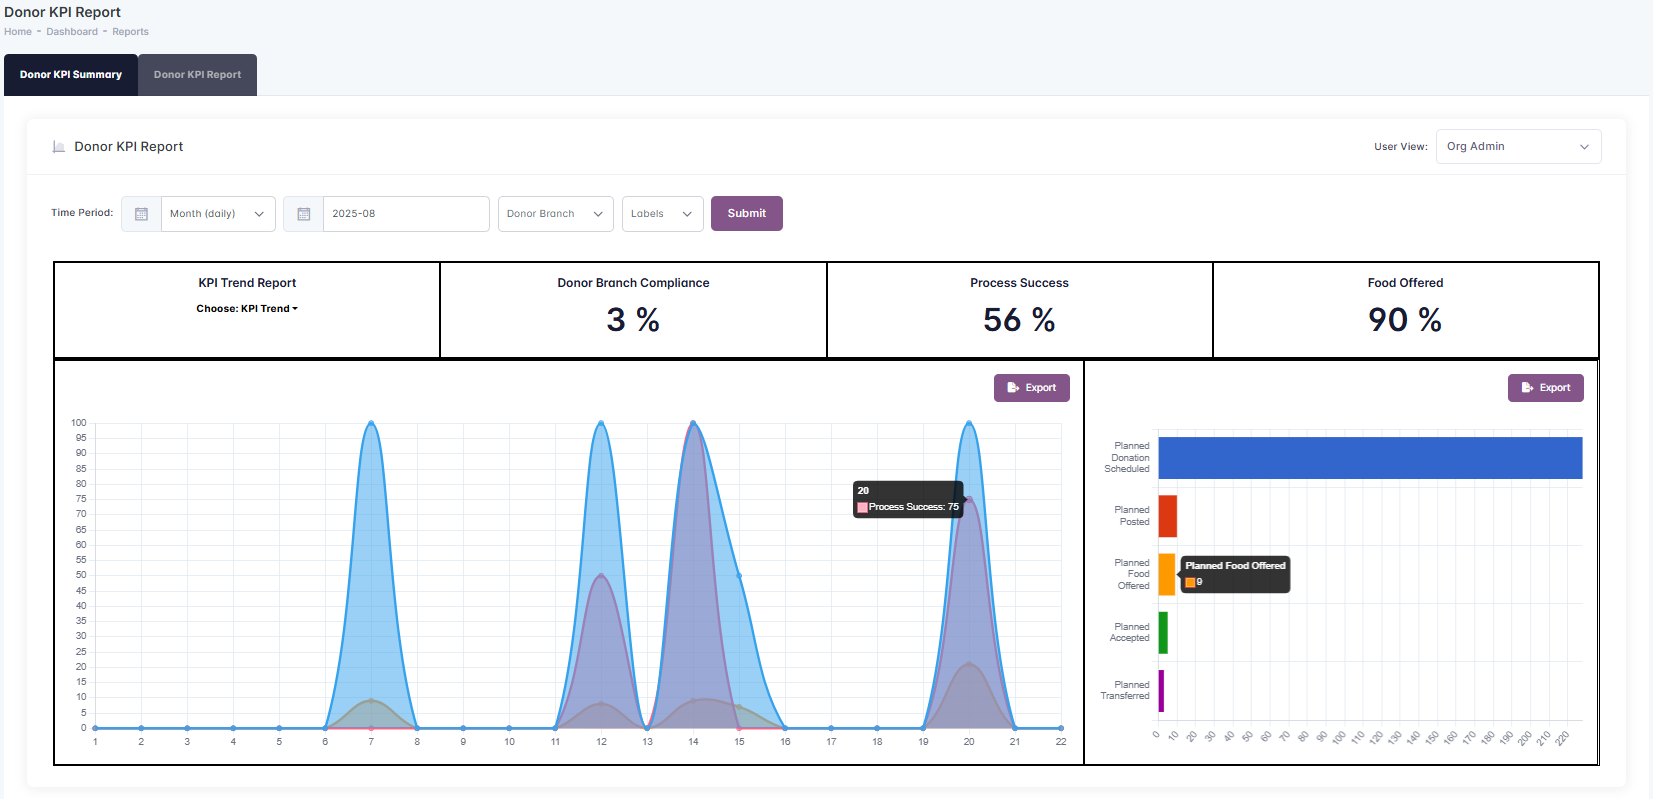
It also displays a Trend Graph of rates over the selected time period.
-
Hover over a point in time in the Trend Graph to display values for that time period
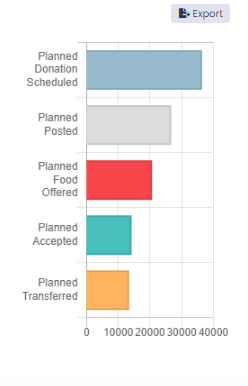
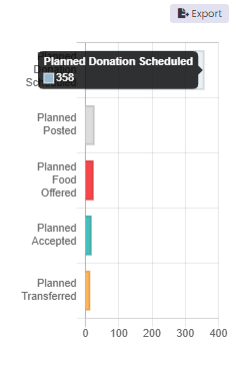
The Histogram chart displays Donation statistics for the Time Period.
-
Hover over individual blocks to reveal the numeric values.
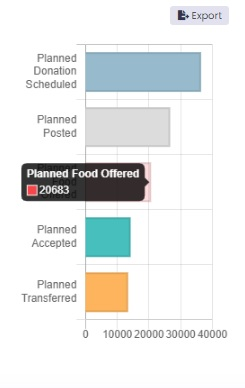
-
Click Export to download the report in CSV format. You can give your downloaded CSV file a description.
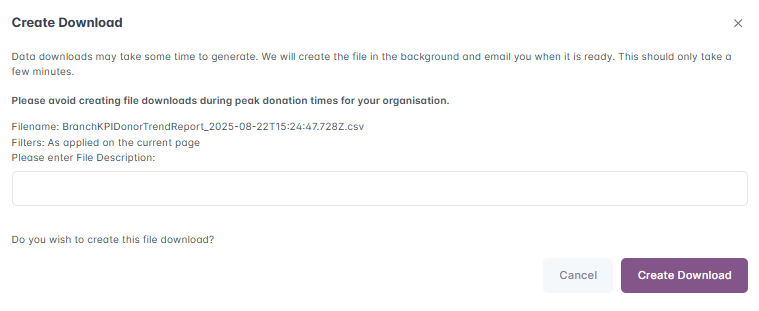
-
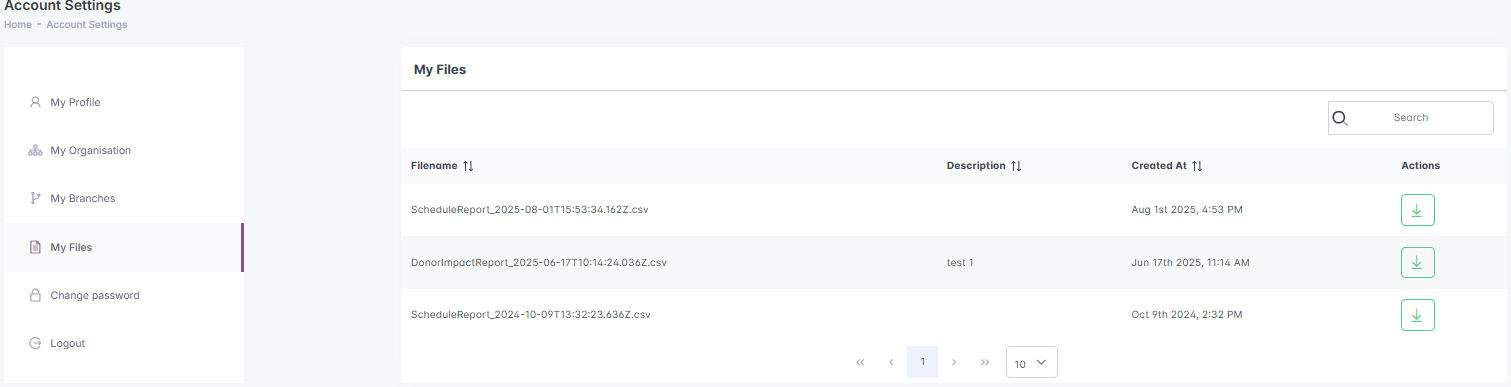
Your downloaded file will be queued for output. You will receive an email when the Export is complete. You can find the download file under My Profile>My Files
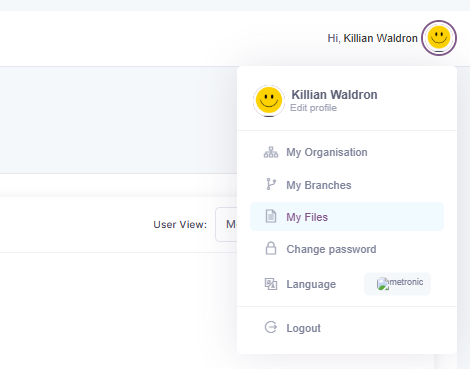
-
Click the Action button to download the file to your PC.
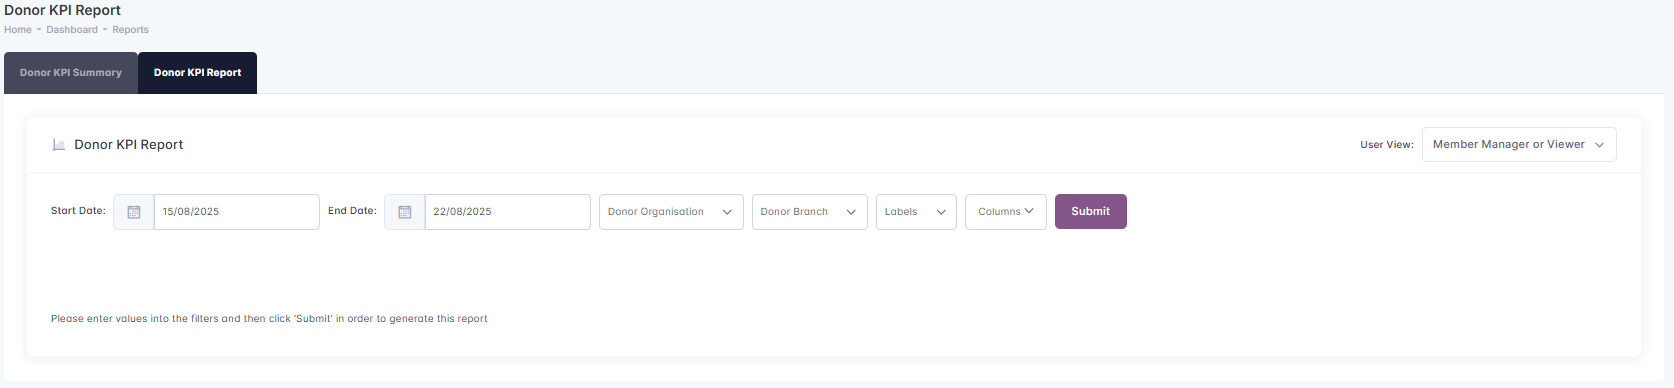
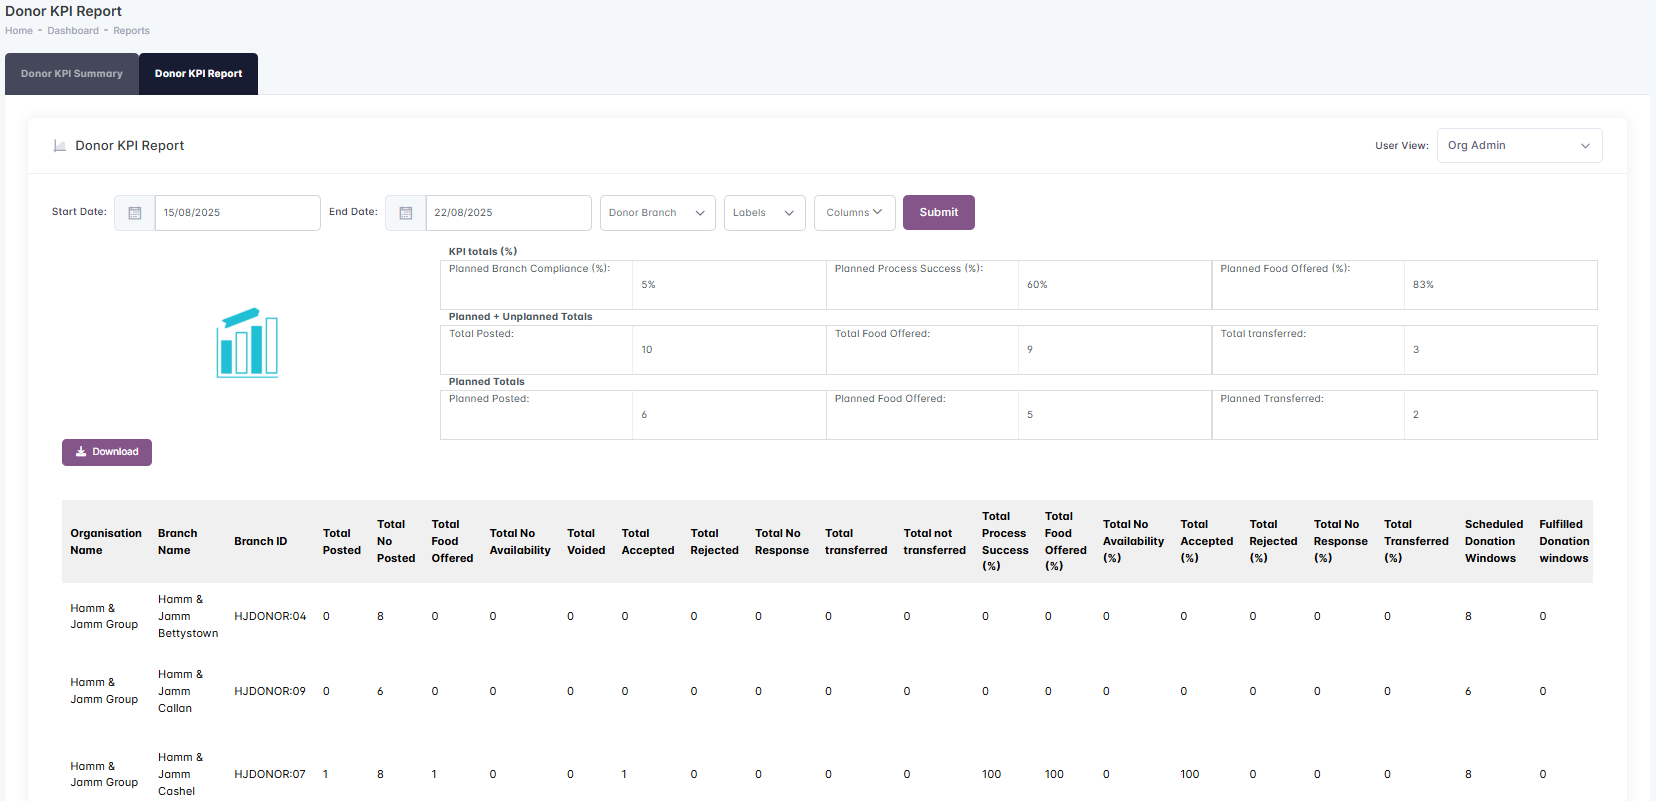
Donor KPI Detail Report
-
The Donor KPI Detail Report displays donor statistics in more detail. It includes a Totals Section.
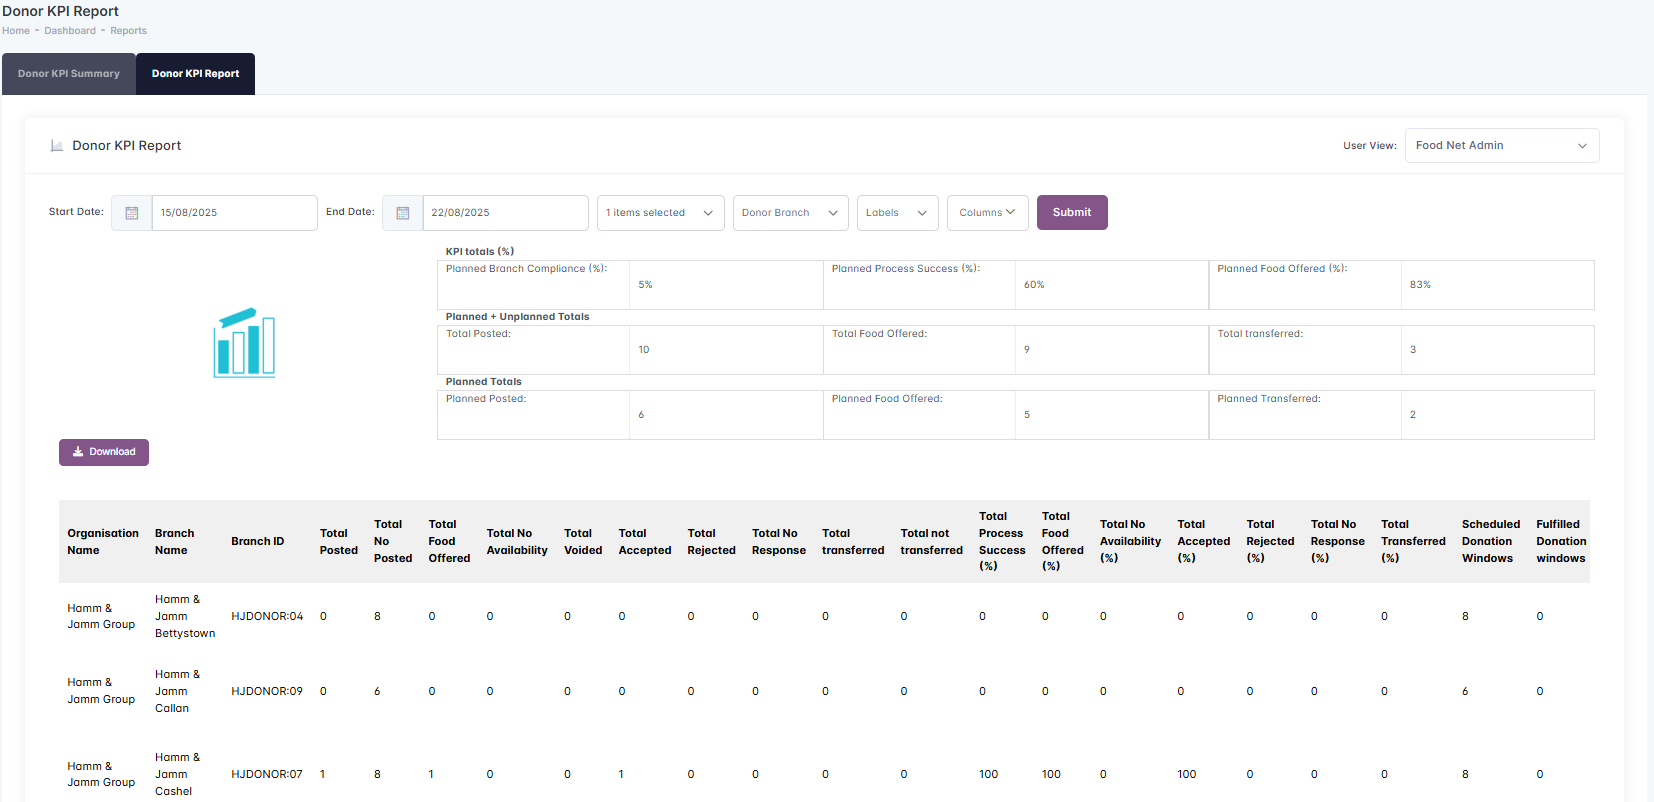
In User View: select FoodNet Admin to view all the donor branches in your food network.
-
Select your Date Range by entering the Start date and End date.
-
Use the Donor Organisation filter to limit the report to a particular donor or donors. (Mandatory)
-
Use the Donor Branch filter to limit the report to particular donor branches of the donor organisation that you have chosen.
-
The Labels filter can be used to search the reporting group.
-
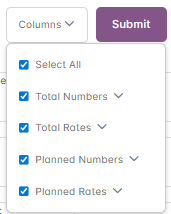
Select metrics from the Columns dropdown menu. The Columns dropdown will default to Total Numbers but you can Select All, Total Numbers, Total Rates, Planned Numbers or Planned Rates or Select individual metrics. Tick the appropriate checkbox and then click the Submit button.
-
The report will update to show you the data according to the filters you’ve applied.
View Summary report as Donor Org Admin or Donor Branch Admin
Step 1: How to find the Donor KPI Summary Report
-
Log into your Foodiverse account using the donor branch login credentials.
-
Select Reports from the left side menu.
-
Under Reports select Donor Branches KPI report
-
The first tab displays the Donor Summary Report, the second Tab display the Donor Detail Report.
Donor KPI Summary Report
Step 2: How to filter the Donor KPI Summary report to suit your search criteria
-
In User View: select Org Admin to view all the donor branches in your organisation.
-
(Donor Branch Admins should choose Branch User or Viewer from the dropdown)
-
Select the Time Period - Month (Daily) will offer a Year/Month filter and display statistics for the Month chosen by Day. (Defaults to current month)
-
Select the Time Period - Year (Monthly) will offer a Year filter and display statistics for the Year chosen by Month.
-
Select the Time Period - All Time (Yearly) will display statistics on an annual basis including current year.
-
Use the Donor Branch filter to limit the report to particular donor branches of your donor organisation.
-
The Labels filter can be used to search the reporting group.
-
Click the Submit button to run the report when you have chosen all your filters.
Step 3: Understanding the output of the Donor KPI Summary report
-
The KPI Summary displays rates for Donor Branch Compliance, Process Success and Food Offered for the Time Period selected.
-
If you have setup RAG thresholds in your Organisation Settings, those featured columns are colour co-ordinated on the Report.
-
-
It also displays a Trend Graph of rates over the selected time period.
-
Hover over a point in time in the Trend Graph to display values for that time period
-
The Histogram chart displays Donation statistics for the Time Period.
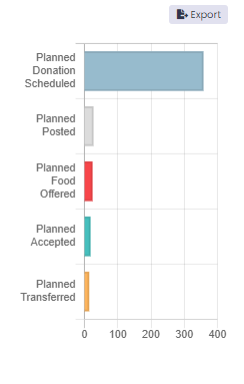
-
Hover over individual blocks to reveal the numeric values.
-
Click Export to download the report in CSV format. You can give your downloaded CSV file a description.
-
Your downloaded file will be queued for output. You will receive an email when the Export is complete. You can find the download file under My Profile>My Files

-
Click the Action button to download the file to your PC.
Donor KPI Detail Report
The Donor KPI Detail Report displays donor statistics in more detail. It includes a Totals Section.
In User View: select Org Admin to view all the donor branches in your food network.
-
(Donor Branch Admins should choose Branch User or Viewer from the dropdown)
-
Select your Date Range by entering the Start date and End date.
-
Use the Donor Branch filter to limit the report to particular donor branches of your donor organisation.
-
The Labels filter can be used to search the reporting group.
-
Select metrics from the Columns dropdown menu. The Columns dropdown will default to Total Numbers but you can Select All, Total Numbers, Total Rates, Planned Numbers or Planned Rates or Select individual metrics. Tick the appropriate checkbox and then click the Submit button.
-
The report will update to show you the data according to the filters you’ve applied.
Related articles
Still haven’t found your answer? Try: